Through the Looking Glass: Analyzing the interplay between memory, disk, and read performance.
Introduction
Understanding the relationships between various internal caches and disk performance, and how those relationships affect database and application performance, can be challenging. We’ve used the YCSB benchmark, varying the working set (number of documents used for the test) and disk performance, to better show how these relate. While reviewing the results, we’ll cover some MongoDB internals to improve understanding of common database usage patterns.
Key Takeaways
- Knowing disk baseline performance is important for understanding overall database performance.
- High disk await and utilization are indicative of a disk bottleneck.
- WiredTiger IO is random.
- A query targeting a single replica set is single threaded and sequential.
- Disk performance and working set size are closely related.
Summary
The primary contributors to overall system performance are how the working set relates to both the storage engine cache size (the memory dedicated for storing data) and disk performance (which provides a physical limit to how quickly data can be accessed).
Using YCSB, we explore the interactions between disk performance and cache size, demonstrating how these two factors can affect performance. While YCSB was used for this testing, synthetic benchmarks are not representative of production workloads. Latency and throughput numbers obtained with these methods do not map to production performance. We utilized MongoDB 3.4.10, YCSB 0.14, and the MongoDB 3.6.0 driver for these tests. YCSB was configured with 16 threads, and the “uniform” read only workload.
We show that fitting your working set inside memory provides for optimal application performance and as with any database, exceeding this limit negatively affects latency and overall throughput.
Understanding Disk Metrics
There are four important metrics when considering disk performance:
- Disk throughput, or number of requests multiplied by the request size. This is usually measured in megabytes per second. Random read and write performance in the 4kb range is the most representative of standard database workloads. Note that many cloud providers limit the disk throughput or bandwidth.
- Disk latency. On Linux this is represented by `await`, the time in milliseconds from an application issuing a read or write before the data is written or returned to the application. For SSDs, latencies are typically under 3ms. HDDs are typically above 7ms. High latencies indicate disks have trouble keeping up with the given workload.
- Disk IOPS (Input/Output Operations Per Second). `iostat` reports this metric as `tps`. A given cloud provider may guarantee a certain number of IOPS for a given drive. Should you reach this threshold, any further accesses will be queued, resulting in a disk bottleneck. A high end PCIe attached NVMe device could offer 1,500,000 IOPS while a typical hard disk may only support 150 IOPS.
- Disk utilization. Reported by `util` in `iostat`. Linux has multiple `queues` per device for servicing IO. Utilization indicates what percentage of these queues is busy at a given time. While this number can be confusing, it is a good indicator of overall disk health.
Testing Disk Performance
While cloud providers may provide an IOPS threshold for a given volume and disk, and disk manufacturers publish expected performance numbers, the actual results on your system may vary. If the observed disk performance is in question, performing an IO test can be very helpful.
We generally test with fio, the Flexible IO Tester. We performed tests on 10GB of data, the ioengine of psync, and with reads ranging between 4kb and 32kb. While the default fio settings are not representative of the WiredTiger workload, we have found this configuration to be a good approximation of WiredTiger disk utilization.
All tests were repeated under three disk scenarios:
Scenario 1
Default disk settings provided by a AWS c5 io1 100GB volume. 5000 IOPS
- 1144 IOPS / 5025 physical reads per second / 99.85% util
Scenario 2
Limiting the disk to 600 IOPS and introducing 7ms of latency. This should mirror the performance of a typical RAID10 SAN with hard drives
- 134 IOPS / 150 physical reads per second / 95.72% util
Scenario 3
Further limiting the disk to 150 IOPS with 7ms latency. This should model a commodity spinning hard drive.
- 34 IOPS / 150 physical reads per second / 98.2% utilization
How is a query serviced from disk?
The WiredTiger Storage Engine performs its own caching. By default, the WiredTiger cache is sized at 50% of system memory minus 1GB to allow adequate space for both other system processes, the filesystem cache, and internal MongoDB operations that consume additional memory such as building indexes, performing in memory sorts, deduplicating results, text scoring, connection handling, and aggregations. To prevent performance degradation from a totally full cache, WiredTiger automatically begins evicting data from the cache when the utilization grows above 80%. For our tests, this means the effective cache size is (7634MB - 1024MB) * .5 * .8, or 2644MB.
All queries are serviced from the WiredTiger cache. This means a query will cause indexes and documents to be read from disk through the filesystem cache into the WiredTiger cache before returning results. If the requested data is already in the cache, this step is skipped.
WiredTiger stores documents with the snappy compression algorithm by default. Any data read from the file system cache is first decompressed before storing in the WiredTiger cache. Indexes utilize prefix compression by default and are compressed both on disk and inside the WiredTiger cache.
The filesystem cache is an Operating System construct to store frequently accessed files in memory to facilitate faster accesses. Linux is very aggressive in caching files and will attempt to consume all free memory with the filesystem cache. If additional memory is needed, the filesystem cache is evicted to allow more memory for applications.
Here is an animated graphic, showing the disk accesses for the YCSB collection resulting from 100 YCSB read operations. Each operation is an individual find for providing the _id for a single document.
The upper left hand corner represents the first byte in the WiredTiger collection file. Disk locations increment to the right hand side and wrap around. Each row represents a 3.5MB segment of the WiredTiger collection file. The accesses are ordered by time and represented by the frame of animation. Accesses are represented in red and green boxes to highlight the current disk access.

Here we see the data file for our collection read into memory. Because the data is stored in B+ trees, we may need to find the disk location of our document (the smaller accesses) by visiting one or more locations on disk before our document is found and read (the wider accesses).
This demonstrates the typical access patterns of a MongoDB query – documents are unlikely to be close to each other on disk. This also shows it is highly unlikely for documents, even when inserted after each other, to be in consecutive disk locations.
The WiredTiger storage engine is designed to “read completely”: it will issue a read for all of the data it needs at once. This leads to our recommendation to limit the disk read ahead for WiredTiger deployments to zero, as subsequent accesses are unlikely to take advantage of the additional data retrieved through read ahead.
Working Set Fits in Cache
For our first set of tests, we set the record count to 2 million, resulting in a total size for both data and indexes of 2.43 GB or 92% of cache.
Here we see strong scenario 1 performance of 76,113 requests per second. Checking the filesystem cache statistics, we observe a WiredTiger cache hit rate of 100% with no accesses and zero bytes read into the filesystem cache, meaning no additional IO is required throughout this test.
Unsurprisingly, in scenarios 2 and 3, changing the disk performance (adding 7ms of latency and limiting iops to either 600 or 150) affected throughput minimally (69,579.5 and 70,252 Operations per second respectively).
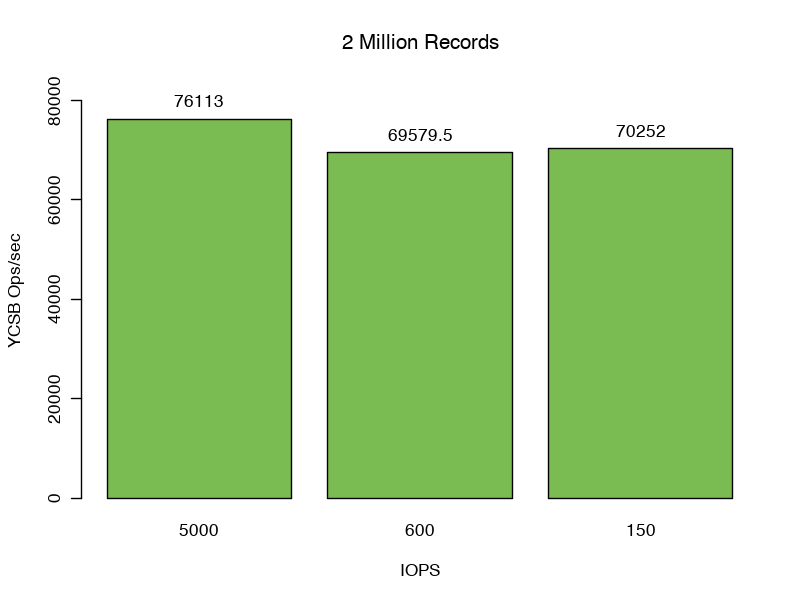
Our 99% response latencies for all three tests are between 0.40 and 0.44 ms.
Working Set Larger than WiredTiger Cache, but Still Fits in Filesystem Cache
Modern operating systems cache frequently accessed files to improve read performance. Because the file is already in memory, accessing cached files does not result in physical reads. The cached statistics displayed by the free Linux command details the size of the filesystem cache.
When we increase our record count from 2 million to 3 million we increase our total size of data and indexes to 3.66GB, 38% greater than can be serviced solely from the WiredTiger cache.
The metrics are clear that we are reading an average of 548 mbps into the WiredTiger cache, but we can observe a 99.9% hit rate when checking the file system cache metrics.
For this test we begin to see a reduction in performance, performing only 66,720 operations per second compared to our baseline, representing an 8% reduction compared to our previous test serviced solely from the WiredTiger cache.
As expected, reduced disk performance for this case does not significantly affect our overall throughput (64,484 and 64,229 operations respectively). In cases where the documents are more compressible, or the CPU is a limiting factor, the penalty reading from the filesystem cache would be more pronounced.
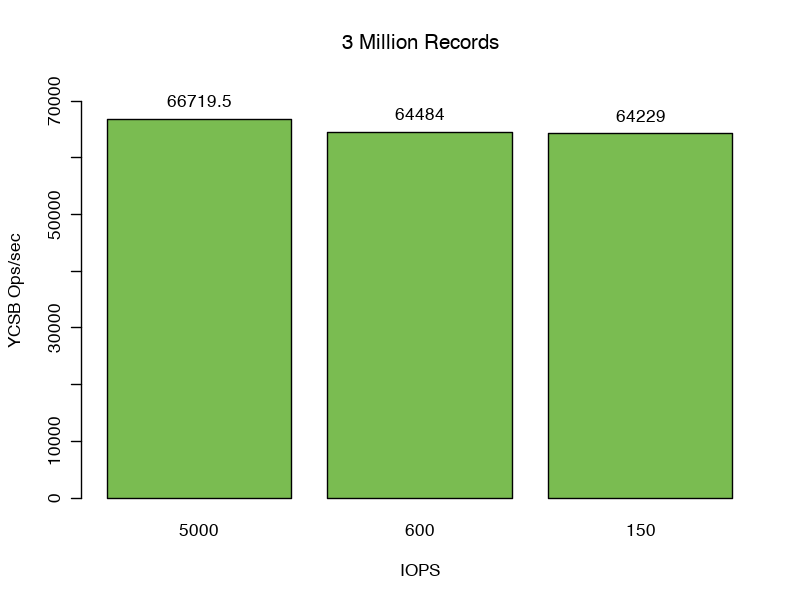
We note a 54% increase in observed p99 latency to .53 - .55ms.
Working Set Slightly Larger Than WiredTiger and FileSystem Cache
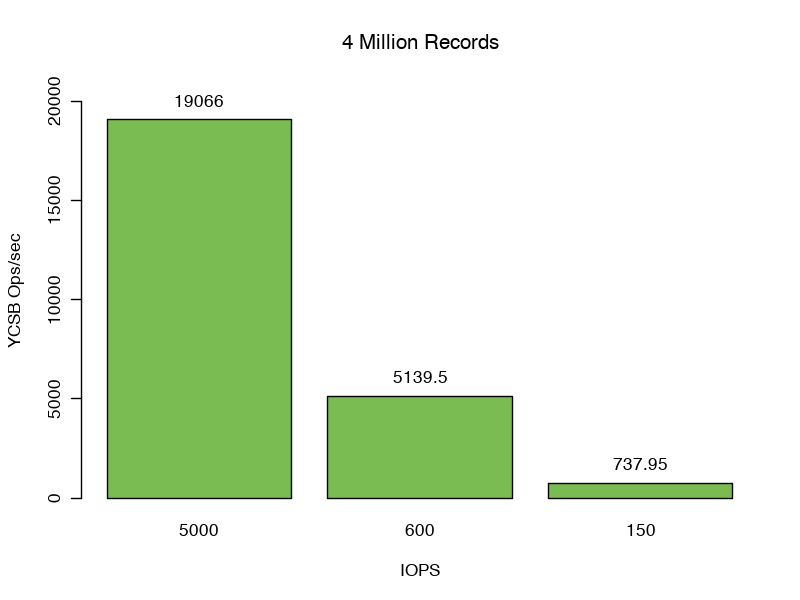
We have established the WiredTiger and file system caches work together to provide data to service our queries. However, when we grow our record count from 3 million to 4 million, we can no longer solely utilize these caches to service queries. Our data size grows to 4.8GB or 82% larger then our WiredTiger cache.
Here, we read into the WiredTiger cache at a rate of 257.4 mbps. Our filesystem cache hit rate lowers to 93-96%, meaning 4-7% of our reads result in physical reads from disk.
Varying the available IOPS and disk latency has a huge impact on performance for this test.
The 99th percentile response latencies further increase. Scenario 1: 19ms, scenario 2: 171ms, and scenario 3: 770ms an increase of 43x, 389x, and 1751x from the in cache case.
We see 75% lower performance when MongoDB is provided the full 5000 iops compared to our earlier test, which fit fully in cache. Scenarios 2 and Scenario 3 achieved 5139.5 and 737.95 Operations per second respectively, further demonstrating the IO bottleneck.
Working Set Much Larger Than WiredTiger and FileSystem Cache
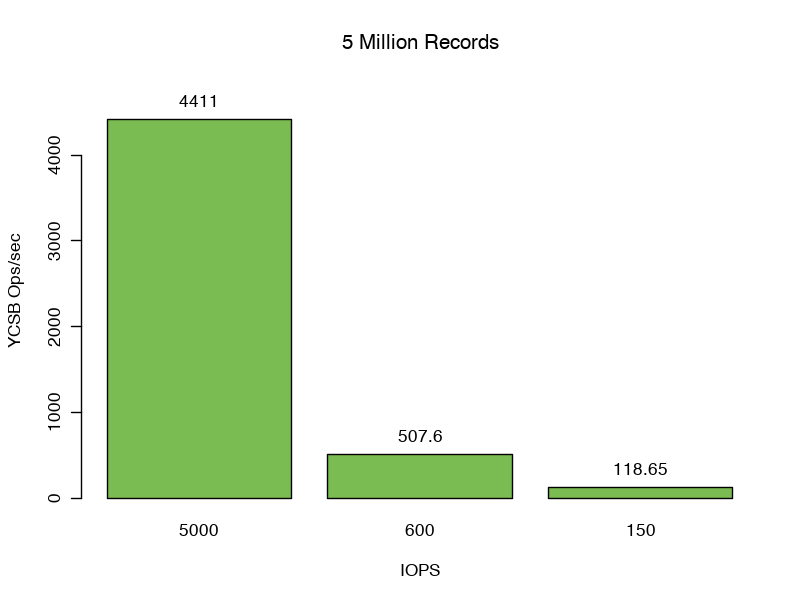
Moving up to 5 million records, we grow our data and index size to 6.09GB, larger than our combined WiredTiger and file system caches. We see our throughput dip below our IOPS. In this case we are still servicing 81% of of WiredTiger reads from the file system cache, but the reads overflowing from disk are saturating our IO. We see 71, 8.3, and 1.9 Mbps read into the filesystem cache for this test.
The 99th percentile response latencies further increase. Scenario 1: 22ms, Scenario 2: 199ms, and Senario 3: 810ms, an increase of 52x, 454x, and 1841x from the in cache response latencies. Here, changing the disk IOPS significantly affects our throughput.
Summary
Through this series of tests we demonstrate two major points.
- If the working set fits in cache, disk performance does not greatly affect application performance.
- When the working set exceeds available memory, disk performance quickly becomes the limiting factor for throughput.
Understanding how MongoDB utilizes both memory and disks is an important part for both sizing a deployment and understanding performance. The inner workings of the WiredTiger storage engine attempts to use hardware to the fullest extent, but memory and disk are two critical pieces of infrastructure contributing to the overall performance characteristics of your workload.